Range Charting

ICE Data Services -

Range Charting

You are now able to query a Chart by a specific range/time interval.  You will see additional intervals available from the Interval Drop down menu.

Interval Description

  • 1Y/D 1 Year, Daily Bars
  • 1Y/W 1 Year, Weekly Bars
  • 1Y/M 1 Year, Monthly Bars
  • 2Y/D 2 Year, Daily Bars
  • 2Y/W 2 Year, Weekly Bars
  • 2Y/M 2 Year, Monthly Bars
  • 5Y/W 5 Year, Weekly Bars
  • 5Y/M 1 Year, Monthly Bars
  • 10Y/W 10 Year, Weekly Bars
  • 10Y/M 10 Year, Monthly Bars
  • 1D(T)/1 Current Day, 1 Min Bars*
  • 1D(T)/5 Current Day, 5 Min Bars*
  • 1D(Y)/1 Previous Trading Day, 1 Min Bars*
  • 1D(Y)/5 Previous Trading Day, 5 Min Bars*
  • 2D/1 2 Days (Current & Previous), 1 Min Bars*
  • 2D/5 2 Days (Current & Previous), 5 Min Bars*

    For 1 & 2 Day Ranges, you can customize the "Interval Bar" that is used to draw the chart.  For example you can type in 1D(T)/10 for a chart of today using 10 minute Bars.

    range charts can be customized just as a normal chart, in terms of plot styles, studies, etc.


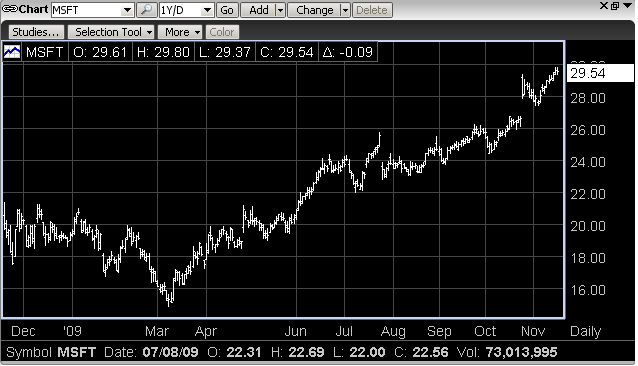
    example of a 1 year daily chart


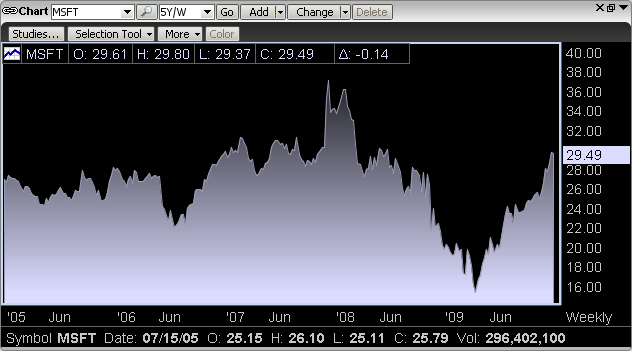
    example of a 5 year weekly chart