faq - how do i overlay a chart?
the new chart window will allow you to overlay multiple symbols in a single chart window. this is done via the add and change menu. enter the symbol to be overlaid and use the add button pull down. (make sure you do not hit your enter key after typing in the symbol you want to overlay)

add menu
the new chart window will allow you to overlay multiple symbols in a single chart window. this is done via the add and change menu. enter the symbol to be overlaid and use the add button pull down. (make sure you do not hit your enter key after typing in the symbol you want to overlay)
add menu
Add |
Menu Description |
Add to New Pane |
Adds symbol to a new Pane in existing Window |
Add as Overlay |
Adds symbol to existing Pane using its own Scale |
Add to Existing Scale |
Adds symbol to existing Pane using existing scale |
When the Add button is pressed without selecting an option from the Drop Down, New Pane is the Default.
When more than one symbol exists, you will see additional options on the drop down indicating pane or scale Number.
CHANGE MENU
To change an existing symbol in a chart with multiple symbols, enter your new symbol in the symbol input box and use the change menu to select existing symbol to replace.

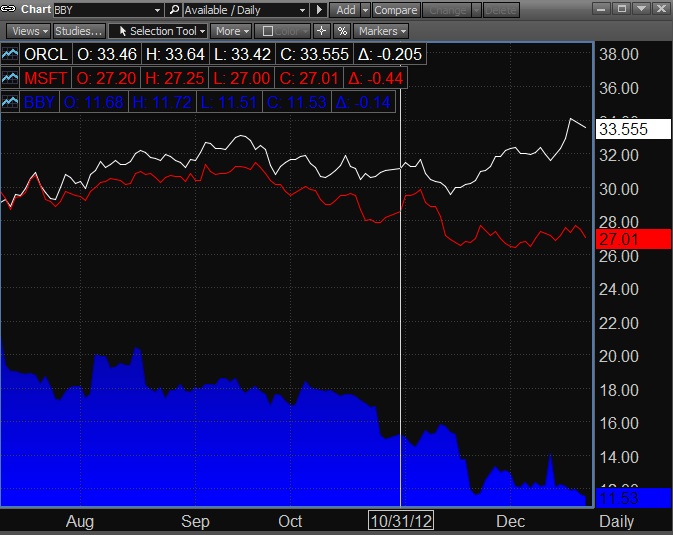
example of an area chart with 2 additional line charts added to the existing scale.
how do you paste the chart into a document?
right mouse on the chart and select copy window image